
Established as a government owned monopoly in 1953, Nippon Telegraph and Telephone Public Corporation ( Nippon Denshin Denwa Kōsha) was one of the first telecomunication businesses to be privatized (1985 ). The aim was to encourage competition in the telecomunication market. In 1987, NTT made the largest public stock offering to date, at US$36.8 billion.
NTT Group consists of the following major companies: NTT East, NTT West, NTT Communications, NTT DoCoMo, NTT Data and NTT Urban Development. NTT DoCoMo and NTT Data are listed on the stock markets.
Nippon Telegraph and Telephone Corporation, together with its subsidiaries, provides telecommunications services to residential and corporate customers. It offers fixed and mobile voice related services, IP/packet communications services, system integration, network system services, as well as data communications services, such as strategic planning, systems planning and systems design, and information communications systems and computer networks installation.
Furthermore, it sells telecommunications equipment and operates telephone networks.
Finally, through its subsidary NTT Urban Development, it engages in building real estate, maintenance of real estate and real estate rental and lease.
 |
| (click chart to enlarge) |
Balance Sheet
NTT's balance sheet composition has changed quite significantly in the last 10 years.
Liquid Assets/ liablities
 |
| (click chart to enlarge) |
NTT was able to grow its current assets while keeping current liabilities almost unchanged, thus leading to an improved liquiditiy position. It's improved liquid position doesn't only manifest itself in superior cash holding, but also is reflected in more favourable current ratio readings (current assets/current liabilities) as well as better quick ratio readings ((current assets -inventory)/current liablities).
 |
| (click chart to enlarge) |
PP&E/ longterm liablities
A significant amount of NTT's book value is in Property, Plant and Equipment (PP&E), which hasn't changed significantly. Especially NTT's large holdings of property could be of interest in the future, if one expects the property market in Japan finding its bottom.
Very determined NTT was in the reduction of its long-term liabilities/ interest bearing debt. From 2000 till 2010 NTT reduced total liabilities by roughly 30% and interest bearing debt by 26%.
 |
| (click chart to enlarge) |
Book Value
NTT has improved its book value significantly in the last 10 years. That happened not only on a per share basis, due to significant share repurchases and share retirement, but also on an absolute basis. Shareholder equity grew by an average of roughly 3% p.a in the last 10 years and EPS at 5% p.a.
Therefore, equity ratio has risen from 31% in 2000 to 41% in 2011.
 |
| (click chart to enlarge) |
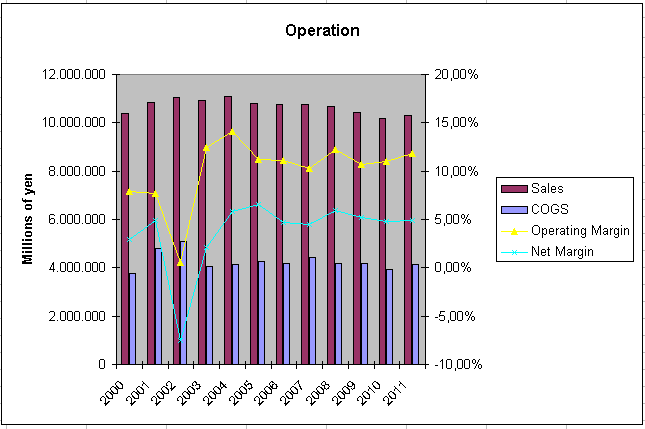
Analysis of Operation
Not only balance sheet composition has seen a shift at NTT, but also sales composition. Legacy business, which is mainly composed of the fixed-line business at NTT East and NTT West, has gone down substantially and business with higher margins and better prospects have got a bigger weighting in NTT's sales.
 |
| (click chart to enlarge) |
Although NTT's sales have been stagnating for almost a decade now, its operating- as well as net income margins are very stable, fluctuating around 11% and 5% respectively. This is mainly due to keeping its costs in check.
The last time margins came under significant pressure was after the bursting of the tech bubble, where NTT had also to post its only loss (2002) in the last 14 years.
 |
| (click chart to enlarge) |
The 12 year average EPS is 276,87 leaving us with an average P/E ratio of 13. Actual EPS is 385 ==> P/E (actual) of 9.
In this period ROE and ROA averaged 5,5% and 2,1% respectively.
Analysis of Cash Flow
Cash flow generation is NTT's forte. Operating cash flow (OCF) per share is ¥ 1911 (average 12 years) and actual ¥ 2139.
 |
| (click chart to enlarge) |
 |
| (click chart to enlarge) |
Although operating cash flow has been very stable in the last 12 years, NTT was able to grow its free cash flow significantly. Especially after NTT's loss year of 2002 free cash flow had a significant boost.
 |
| (click chart to enlarge) |
This improved free cash-flow metrics are mainly attributable to a decreased capital expenditure (capex).
 |
| (click chart to enlarge) |
Actual free cash flow yield stands around 30% and the average (12 years) at 20%.
Analysis of Dividends and Treasury Stocks
NTT is actually paying a dividend of ¥ 140 per share, with a pay-out ratio of roughly 30%. Apart from the very decent dividend yield of 3,8% NTT has got, it also has a good track-record lately in increasing its dividend payments.
 |
| (click chart to enlarge) |
As mentioned before, NTT had repurchased a significant amount of own shares. Although repurchases have stopped recently, there has been negotiations going on between NTT and the Ministry of Finance (who holds a substantial amount of NTT's outstanding shares) regarding repurchases of its stocks. NTT's projection for share repurchase in 2012 are shown in the chart beneath.
 |
| (click chart to enlarge) |
Conclusion
NTT is an income generating japanese blue chip stock, which is more than reasonably valued and should always be considered as a part of any diversified japan portfolio.
Especially on a cash-flow basis NTT appears to be very cheap, with P/OCF-ratio of 2 and FCF yield (average) of 20%.
Personally I find NTT's property portfolio of interest, as I expect the property market in Japan to bottom after the 20 year slump. Through its wholly owned subsidary NTT Urban Development, NTT is offering me some decent exposure to the japanese real estate market.
Disclosure: long NTT
)
No comments:
Post a Comment