Personal Remarks
So far, apart from a very few exceptions, I have been concentrating my investments in Japan into japanese domestic value stock (JDVS), or stocks that mainly generate there sales in Japan. Given the recent sell-off, especially in the large-cap stocks, I was asking myself if there was value beeing found in the japanese multinational large-cap sphere.
Company Overview
Kyocera Corporation,formerly known as Kyoto Ceramic Kabushiki Kaisha, manufactures, distributes, and sells industrial components, and telecommunications and information equipment worldwide. Kyocera Corporation was founded in 1959 and is headquartered in Kyoto, Japan.
Kyocera has got two main business segments; component segment and equipment segment.
For further inside into Kyocera's company profile I recommend reading:
http://www.referenceforbusiness.com/history2/3/Kyocera-Corporation.html
 | |||||
| (click chart to enlarge) |
Analysis of Operation
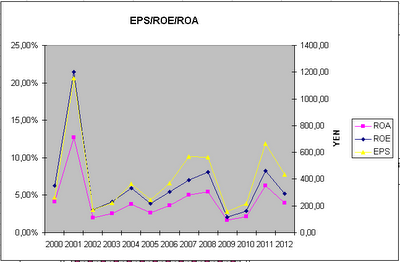
Having avoided massive write-downs and losses in the recent past, Kyocera stands out in the japanese sphere of large multinationl companies.For at least twelve years kyocera has been profitable.On average sales have grown around 4% p.a for the last 12 years. Operating- as well as net-margins are quite volatile (in general there is very little smoothing of earnings going on in Japan).
Cyclical ajusted P/E stand at 16 and actual P/E 15. On a P/E basis the stock doesn't appear cheap.
Operating margins on the component business is higher than on equipment business.
Although, Kyocera's sales are geopgraphically well diversified, sales in Japan still represent the biggest chunk of overall sales.
Analysis of Cash-Flow
Kyocera is cash flow positive and als FCF has been always positiv in the last 12 years.
Furthermore, even the more stringent. The more stringent FCF metric (OCF-CFI) has seen markedly negative readings only once in 2009.
Actual FCF yield reading stands at 3,5%. The average yield is 5,4%, slightly higher.
the actual reading.
Analysis of Balance Sheet
Kyocera is almost debt free.Current ratio as well as the acid test are at more than healthy levels.
Cash holdings represents the biggest chunk of current assets and represents roughly 40% of market cap.
Liquidation Value + the value of Kyocera's investmentportfolio add up to roughly 65% of market cap.
BPS has increased by approx. 6% p.a. in the last twelve years.
Current P/B ratio is 0,8.
Analysis of Pay-out
Kyocera hasn't been a cash cow dividendwise and the dividendyield is a meager 1,8%, with a modest pay-out ratio of 30%.Kyocera has embarked on share buybacks in a rather timid manner. With even unloading treasury stocks, which had been purchased in prior years, between 2006 to 2009.
Conclusion
Kyocera is showing decent valuation readings, but far from beeing spectecular.It was able to grow BPS at an average rate of 6% p.a over the last twelve years. But during that time frame dividend payments were very poor, reinvesting most of generated income back into the business.
Most striking is the solid equity ratio (77%) and the rock solid composition of its assets (in the majority current assets (mainly cash) and longterm investments.
Kyocera could be an interesting stock in the (near) future, but I don't see any need to pile into the stock in a hurry.
Disclosure: no position


No comments:
Post a Comment