Company Overview
Shinko Shoji was founded in 1953 and is headquartered in Tokyo, Japan. At its beginning the company engaged mainly in trading electronic motors and transformers.
Later on Shinko Shoji started trading components of NEC. By 1957 the company was the official intermediary of NEC for a wide range of its products. The NEC spin- off Renesas still is the main supplier to Shinko Shoji, and with 2,5 % of the shares outstanding also a major shareholder.
In the 1960's TDK and other companies joined and the company began to expand and opening branch offices all over the world. By now there are 11 branch offices in Japan and 12 in the rest of the world. Most of the foreign branch offices are located in the East-/ South- East Asian region, but also in North America and Europe.
Partially the company has been growing through take- overs. But the company also divested. For example did the company sell the distribution business for Texas Instrument.
Shinko Shoji mainly trades semiconductors, displays, software, etc. Apparently, the company does also engage in genuine R&D. Own R&D, but more importantly good contacts to suppliers and customers should not be underesteemed, and even could constitute a certain moat.
Nevertheless, is the Japanese electronic trading business very crowded and characterized by fierce competition. Many players exist in this business sector of the Japanese economy like, for example, Ryoyo Electro, Ryosan, Tachibana, Sanchin Electric, etc. Thus, it comes as no surprise that operating margins in the sector, and at Shinko Shoji too, are annoyingly low and most of those companies trade below book value, or even below liquidation value.
General Valuation
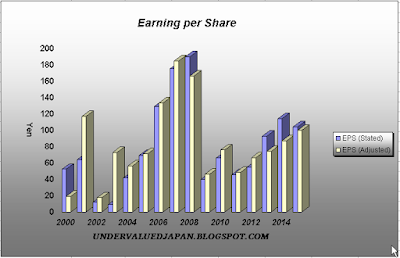
EPS for FY 2014 came in at 104 Yen leading to an actual P/E ratio of 13.
Average EPS for the last 16 Years was 79 Yen leading to an average P/E ratio of 17.
The P/E ratios do not appear really compelling for such a low margin business like Shinko Shoji. But price ratios in general are very flawed. Especially in corporate Japan with its high cash balances, big investment portfolios and low financial gearing.
To adjust for the financing of the company EV/ Ebit and EV/ Ebitda ratios are used. The enterprise value (EV) of the company stands at 10'208 Mios of Yen and is with 6'811 Mios. of Yen even significant lower when the investment portfolio is excluded. With an Ebit of 4'052 Mios. of Yen and Ebitda of 4'234 Mios of Yen the EV/Ebit and EV/ Ebitda ratio for FY 2014 is 2,5 and 2,4 respectively.
If the investment portfolio is excluded the ratios become even more compelling with 1,7 and 1,6.
NOPAT (=Normalized operating profit after tax) for FY 2014 is 2'377 Mios. of Yen. Thus, EV/ Nopat shows a reading of 4,3. Significantly lower than the P/E ratio.
Especially the EV based valuations show how cheap the stock is trading at the prevailing stock price.
Analysis of Operations
In the last 16 years Shinko Shoji has been profitable. There was not a single year where the company recorded a loss.
Although sales fluctuated significantly in the last 16 years the company was always able to shield its bottom line from severe sale declines. Especially the low operating and financial leverage contributed to that fact.
As mentioned before Shinko Shoji has annoyingly low operating margins. Actual operating- and net- margins for FY 2014 are 2,9% and 1,7%. The average margins are not any better (2,4% and 1,25%).
With actual and average readings of 4,3% the ROE of the company is decent.
Analysis of Cash- Flow
Operating cash flow is very volatile, with several years of negative readings. Shinko Shoji finances most of its working capital needs internally. Build- up and cut backs in working capital therefore has a big impact in operating cash- flow metrics. The company is Capex light. Capex expenditure is negligible. Nevertheless, are cash- flows of investing activities very volatile. The main reason is that the company tends to invest and divest a lot in financial assets.
As free cash- flow can be huge in some years and highly negative in others it makes more sense to look at Shinko Shoji's average free cash- flow generation. On average (16 Years) the company was able to generate 70 Yen FCF (strict) per share. At current stock price this leaves us with a decent FCF yield of 5,2%.
Analysis of Balance Sheet
Shinko Shoji is not debt free. But with 4'644 Mios. of Yen it is negligible as it represents only 8% of total shareholder equity.
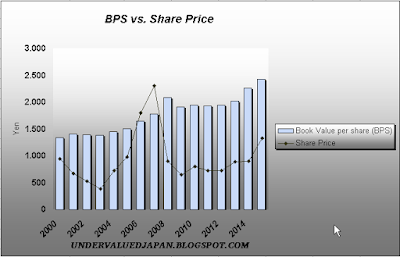
Shinko Shoji's equity ratio is 67% and stated Book value per share (BPS) stands at 2'425 yen. That leads us to a price to book ratio (P/B) of 0,55.
In the last 16 years the company was able to increase its BPS 4,19% p.a.
Shinko Shoji's book value is highly liquid. Most of the current assets are comprised of cash, cash equivalents and receivables.
As mentioned in the title of the post Shinko Shoji is what I call a J- Net stock, i.e. a Japanese net- net stock. Liquidation value (incl. Investment portfolio) is 1'467 Yen per share. The closing price of the stock on Friday was 1'330 Yen per share. Thus, the stockmarket valuation is showing a 10% discount to Shinko Shoji's liquidation value.
Net current assets value (NCAV) per share (incl. Investment portfolio) is 2'257 Yen. Hence, if one bought the share now at sub- liquidation value and sell should it reach NCAV value the investor would lock in a profit of 70%.
What really strikes me with Shinko Shoji is its impressive rising trend in the liquidation value over the last 16 years. Significant increases in Shinko Shoji's cash balance combined with keeping total liabilities steady is the main reason for this increase in Shinko Shoji’s liquidation value.
Analysis of the Pay- Out Policy
Shinko Shoji has constantly been paying a dividend in the last 16 years. It even increased dividend payments on several occasions and only cut back the payment slightly in FY 2010 and 2011. Currently it is paying 40 Yen per share, which is giving the stock a dividend yield of roughly 3%.
The dividend payout ratio for FY2014 was 40%. That has to be deemed as OK but not great. Given the limited growth prospect of the company even higher pay- out ratios should be warranted. Especially in form of share repurchases. The company never engaged in any significant repurchase program. Contrarily, in FY 2008 it even issued shares for the financing of an acquisition. Such a financing policy is totally incomprehensible given the high internal reserves the company possessed.
Fortunately, Shinko Shoji's management appears to have changed mind as it recently has announced a share repurchase of roughly 4% of the outstanding shares.
Intrinsic Value
Following are some calcualtions concerning Shinko Shoji’s intrinsic value other than liquidation value and NCAV.
Ownership Structure
Founder and actual chairman Akio Kitai and its family are the major shareholders of the company (12,5 % of the shares outstanding).
The well-known value fund Tweedy, Browne Co. LLC holds 1,77 % of the outstanding shares.
Risk Factors
Generally, Shinko Shoji's business is cyclical in nature. But a diverse product portfolio and low operating- / and financial leverage functions as a cushion.
Furthermore, if Shinko Shoji's suppliers failed to spot major trends in the industry the company could lose market shares.
In addition, major customers could move its production site to other countries. Although, Shinko could move along with the customers to a certain extent, it will nevertheless lose market share when the market with established customer relationships collapses.
Last but not least, the main downside risk in the stock is to be found in its financing of receivables. If business conditions start to deteriorate significantly those receivable could become bad debts.
Conclusion
Shinko Shoji is a high quality J- net stock operating in a segment of the Japanese economy that is characterized by fierce competition and thus, exhibits low return metrics. Nevertheless, has the company been profitable for the last 16 years and a constant dividend payer.
Most impressed I am by Shinko Shoji's ability to increase the liquidation value significantly over time. A drop of bitterness in the past was the management's seemingly unwillingness to recognize and tackle the undervaluation in the stock. The recent announcement of significant share repurchases could signal a change of mind on the management side.
Disclaimer: No Postition


Good write-up. Thanks!
ReplyDeleteThanks Juan.
Delete